Immagine:Dutycycle.png
Da Wikipedia, l'enciclopedia libera.

Dimensioni di questa anteprima: 800 × 280 pixel
Versione ad alta risoluzione (1500 × 525 pixel, dimensioni: 12 KB, tipo MIME: image/png)
Questo file proviene da Wikimedia Commons, per ulteriori informazioni vedi la sua pagina di descrizione.
Se non hai mai usato Commons, visita la pagina di benvenuto, o leggi le FAQ.
[edit] Summary
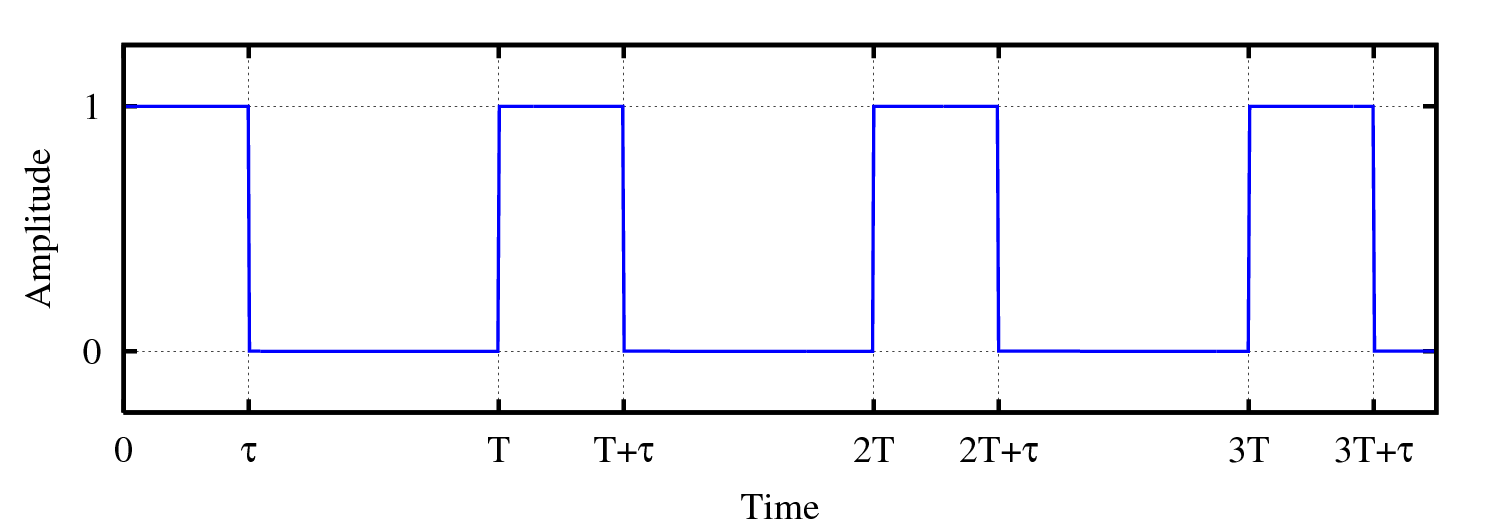
Cyril BUTTAY
This figure represents a rectangular waveform used to define the concept of dutycycle. It has been generated using the following gnuplot code (executed by gnuplot 4.0):
# This file is used to generate a plot that defines the
# concept of duty cycle

# graph configuration
set terminal postscript eps enhanced "Times-Roman" 18 color solid
set encoding iso_8859_15
set size 1,0.5
unset title
set line style 1 lt 3 lw 3 pt 0 ps 0
set border 15 lt 7 lw 4

set grid xtics ytics
set ylabel "Amplitude"
set xlabel "Time"
set samples 1000

# equation of the signal
dutycycle=0.333333
signal(x) = x-floor(x)>dutycycle?0:1

set xtics ("0" 0,"{/Symbol t}" dutycycle,\
        "T" 1, "T+{/Symbol t}" 1+dutycycle,\
        "2T" 2, "2T+{/Symbol t}" 2+dutycycle,\
        "3T" 3, "3T+{/Symbol t}" 3+dutycycle)
set ytics ("0" 0, "1" 1)

set output "dutycycle.eps"
plot [0:3.5][-0.25:1.25] signal(x) ls 1 title ''
And the eps file has been converted into png using the following command (linux)
convert -density 300 dutycycle.eps dutycycle.png
[edit] Licensing

Pagine che usano questa immagine
Le pagine seguenti richiamano questa immagine:

