Imagen:CO2-Temp.png
De Wikipedia, la enciclopedia libre

Dimensiones de esta vista previa: 800 × 429 píxeles
Ver la imagen en su resolución original (1200 × 644 píxeles; tamaño de archivo: 22 KB; tipo MIME: image/png)
| | Éste es un fichero de Wikimedia Commons, un depósito de contenido libre hospedado por la Fundación Wikimedia. Más abajo se reproduce su página de descripción con la información sobre su origen y licencia. |
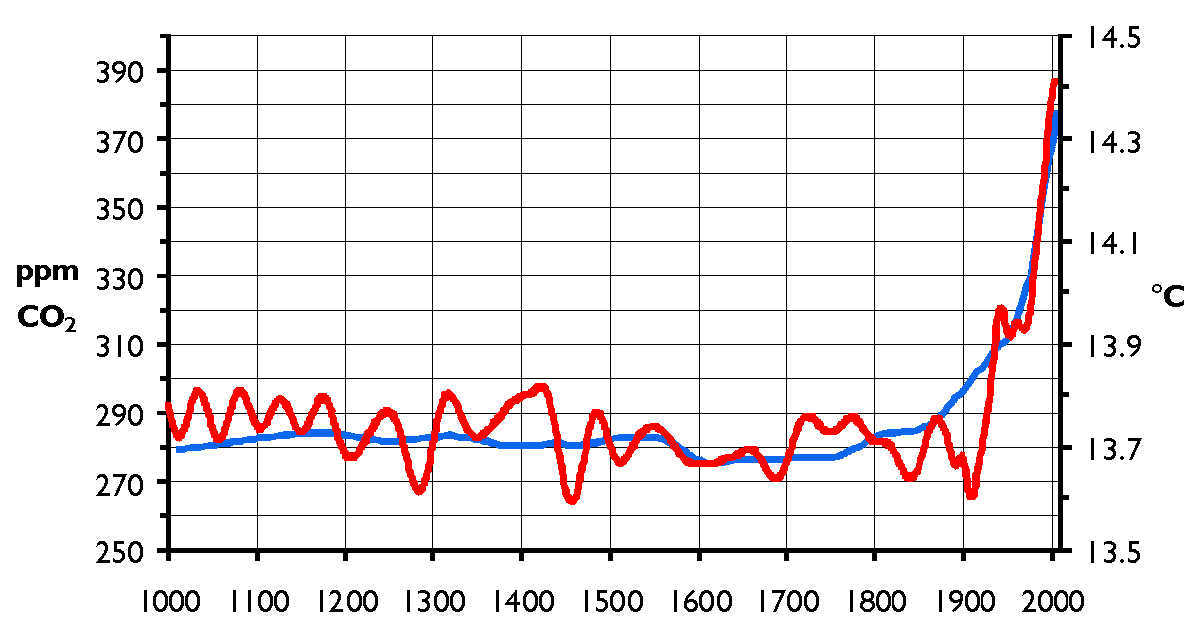
- Description: Atmospheric carbon dioxide concentration and mean global temperature during the past 1000 years. Carbon dioxide levels (blue line, left-hand axis) are given in parts per million (volume), temperatures (red line, right-hand axis) in degrees centigrade.
- Source: graph drawn by Hanno using data from different sources. For the temperature data, see Global temperature 1ka.png. CO2 levels are based on historical carbon dioxide records from ice cores drilled at the Law Dome in Antarctica, published on the web by D.M. Etheridge, L.P. Steele, R.L. Langenfelds & R.J. Francey (1998) as "Historical CO2 records from the Law Dome DE08, DE08-2, and DSS ice cores". In Trends: A Compendium of Data on Global Change. Carbon Dioxide Information Analysis Center, Oak Ridge National Laboratory, U.S. Department of Energy, Oak Ridge, Tenn., U.S.A. [http://cdiac.esd.ornl.gov/trends/co2/lawdome.html]
- Licence: released under the GNU Free Documentation Licence and the cc-by-sa-2.5 Licence by the photographer
|

Enlaces a la imagen
Las siguientes páginas enlazan a esta imagen:

